- home
- ESG Information Index
- Response to Climate Change and Environment Conservation

Mebuki Financial Group, as a comprehensive financial services group working together with local communities, is engaged in environmental initiatives to maintain the bountiful and beautiful natural environment and pass on it in a healthy state to the future. Specifically, the Group supports businesses related to greening and environmental conservation, provides environmental related financial products, establishes environment-friendly branches, and makes donation to forest protection funds. Its employees also have participated in forest development activities.
Initiatives for Environment Conservation
Mebuki Financial Group shows its stance on initiatives to address environmental issues in its Corporate Ethics, the basic policy in conducting its business activities, and engages proactively in environmental conservation activities through its group companies.
(Excerpt from Article 10 of Mebuki Financial Group’s Corporate Ethics)
The Group will act proactively to realize a sustainable environment and society that is highly resilient to changes in the global environment and social conditions, and other trends.
Group Environmental Policy
Mebuki Financial Group has a Group Environmental Policy based on the belief that enhancing the sustainability of society requires revitalizing economies through coexistence with nature while preserving the global environment such as efforts to address climate change and conserve and restore natural capital and biodiversity. Recognizing that addressing climate change is a key issue for the global environment, we have worked to reduce environmental burden in our corporate activities and supported local communities in making efforts toward decarbonization.
Establishment of Procurement and Purchasing Guidelines
Mebuki Financial Group established the Group-wide Procurement and Purchasing Guidelines in January 2023 to engage in responsible purchasing activities in consideration of the environment and society when procuring and purchasing goods and services necessary for its business activities.
The Group also works together with suppliers to realize a sustainable society.
3.Basic Policy on Procurement and Purchasing
With due consideration of the necessity of procurement, the Group will procure products and services that are environmentally friendly or that have as little environmental impact as possible, in addition to their quality and economic rationality, giving priority to suppliers who are committed to reducing their environmental impact.
Response to Climate Change
Initiatives for TCFD Recommendations
Mebuki Financial Group considers responding to global warming and climate change a key priority issue and declared support for the TCFD Recommendations in March 2021. The objective of the Paris Agreement is to realize a decarbonized society—to hold the increase in the global average temperature to well below 2℃ above pre-industrial levels and to pursue efforts to limit the temperature increase to 1.5℃. To this end, we will put more effort into responding to climate change, for example, reaching out to our supply chain, which includes the entities that we make investments in and provide loans to, and implementing initiatives to achieve net-zero CO2 emissions at the Group, thereby accelerating our contribution to realizing a decarbonized society and the sustainable growth of local communities.
We will also enhance our disclosures based on the Task Force’s recommended disclosures, namely Governance, Strategy, Risk Management, and Metrics and Targets, and proactively disclose these thematic areas, thereby increasing stakeholder engagement.
Governance
Formulation of policies
To further reinforce its initiatives for sustainability issues※ including climate change, Mebuki Financial Group has formulated Group Sustainability Policy, Group Environmental Policy, Environmentally and Socially Friendly Investments and Loans Policy, and Procurement and Purchasing Guidelines. Positioning the sustainability issues as important management agendas, the Group has operated its business based on these policies.
※Initiatives for achieving both the sustainable growth of the Group and the resolution of environmental/social issues in local regions
Supervision by the Board of Directors
To establish a structure that uniformly manages the development and progress of initiatives related to sustainability issues, including climate change, we have set up the Sustainability Committee chaired by the President and Director and have held committee meetings as frequently as once in six months or more.
We have also built a structure in which the Board of Directors can supervise the Group’s sustainability initiatives by having the Sustainability Committee report the details of deliberations at each committee meeting to the Board of Directors and giving instructions to the committee as necessary. Key sustainability issues are proposed to discuss at meetings of the Board of Directors, and it makes decisions on them.
Establishment of dedicated organizations
In April 2022, the Group newly established organizations dedicated to sustainability (Sustainability Management Group within Mebuki Financial Group, Inc.; and Sustainability Promotion Office within subsidiary banks, Joyo Bank and Ashikaga Bank). The Group will bring together its functions and knowledge to accelerate group-wide initiatives toward realizing sustainable local communities.
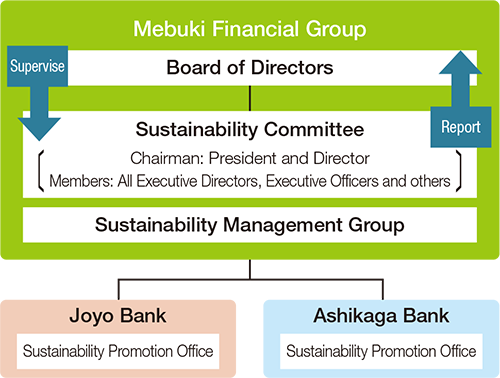
Main matters related to climate change discussed by the Sustainability Committee and reported to the Board of Directors in FY2022
- Creation of a roadmap for reducing CO2 emitted by the Group
- Establishment of Procurement and Purchasing Guidelines
- Reporting of the results of the scenario analysis of climate change
※The Sustainability Committee met 7 times in FY2022.
Strategy
Economic development is dependent on social conditions such as livelihood and education, and society is supported by the natural environment. The maintenance and conservation of the environment is a prerequisite for realizing sustainable local communities and achieving the sustainable growth of both local communities and Mebuki Financial Group. For this reason, we recognize that addressing the issue of climate change is a significant challenge for the global environment and also an important issue for our business strategies. We have therefore stipulated in the Group Environmental Policy that the Group is committed to realizing a decarbonized society.
Mebuki Financial Group has identified climate changerelated opportunities and risks that are expected to impact its business activities as shown below, and assessed the financial impacts of the identified opportunities and risks. Based on the results of the assessment, the Group has been working to mitigate the risks and seize the opportunities.
1.Opportunities
(1)Awareness of opportunities
We are aware of climate change-related opportunities as follows:
| Details | Time frames | |
|---|---|---|
| Increased business opportunities |
|
Short- to long-term |
| Cost reduction |
|
Short- to long-term |
| Enhanced social reputation |
|
Medium- to long-term |
※Short-term: approx. 5 years; Medium-term: approx. 10 years; Long-term: approx. 30 years
(2)Efforts to seize the opportunities we are aware of
Provision of services that support climate change measures
Making efforts to achieve carbon neutrality is essential for business continuity and sustainable growth and has become an important management issue even for local small and medium-sized enterprises positioned in the supply chains of listed and large companies that actively engage in decarbonization management.
With global warming, disasters have become more severe and frequent. Preparing for such disasters is also essential for business continuity.
For these reasons, the Group actively supports its corporate customers in taking climate change measures by providing funds and consulting services.
List of primary services
| Non-financial services | Financial services | |
|---|---|---|
| Awareness raising |
|
|
| GHG emissions reduction |
|
|
| Disaster prevention measures |
|
|
Decarbonization and cost reduction through the promotion of energy saving
Establishment of environment-friendly new branch offices
We have been newly establishing environment-friendly branch offices by installing solar power generation systems and switching lighting to LED bulbs, for instance.
Status of establishment of environment-friendly branch offices(as of March 31, 2023)
| FY | Number of branch offices | |
|---|---|---|
| 2022 | Joyo Bank | 118 |
| Ashikaga Bank | 109 |
Adoption of environmentally friendly fuel-efficient cars
We have been gradually replacing our fleet used for sales activities with more fuel-efficient models, as well as promoting the adoption of electric and fuel cell vehicles.

Entry into renewable energy power generation business
Demand for renewable energy in local regions has been rapidly growing, and there has been a more apparent need for renewable energy among not only large companies but also local companies for their internal use. In July 2022, Joyo Green Energy Co., Ltd. was established to contribute to the region’s carbon neutrality by acquiring and generating renewable energy (RE) power and their derived businesses. The company acquired approximately 5 MW from solar power generation facilities as of May 2023, which is the equivalent amount of electricity consumed by 1,500 ordinary households, and supplied power. The company also started to sell J-Credit and supply power in cooperation with local governments and through a PPA.
Support for and participation in initiatives
The Group considers cooperating with international organizations, the government, and other companies to be important for accelerating sustainability initiatives, including response to climate change. The Group therefore endeavors to actively participate in initiatives.


2.Risks
Using the scenario analysis approach, the Group has worked to better understand climate change-related risks through its loans portfolio. In the ongoing scenario analysis, the Group has pursued the sophistication of analytical methods and expanded the scope of analysis.
We expanded the scope of analysis to assess physical risks from Ibaraki Prefecture and Tochigi Prefecture in the previous fiscal year to nationwide. We added the Metals and Mining sector to the sectors subject to the analysis of transition risks. We also increased the sectors subject to the analysis of carbon-related assets from only the energy sector to four sectors.
(1)Awareness of risks
We are aware of climate change-related risks as follows:
| Risks | Details | Time frames | |
|---|---|---|---|
| Physical risks |
|
|
Short- to long-term |
| Transition risks |
|
|
Medium- to long-term |
|
|
Short- to long-term |
※Short-term: approx. 5 years; Medium-term: approx. 10 years; Long-term: approx. 30 years
(2)Scenario analysis
The Group has conducted the scenario analysis of physical risks and transition risks to assess the resilience of the Group’s organizational strategy while taking into consideration climate change scenarios and enhance dialogue (engagement) with its corporate customers. Here is the overview of the scenario analysis in FY2022.
Physical risks
Ⅰ Qualitative analysis
We have analyzed the risks that customers could face from the perspective of physical risks.
| Evaluation items | Major risks |
|---|---|
| Increased severity of extreme weather events (acute risks) |
|
Ⅱ Quantitative analysis
As to the impact of flooding damage caused by typhoons and other natural disasters, we conducted a quantitative analysis in the previous fiscal year through surveys on customers with their business locations in Ibaraki Prefecture and Tochigi Prefecture, the Group’s core areas of business. In the current fiscal year, we expanded the scope of analysis to nationwide and conducted the same analysis.
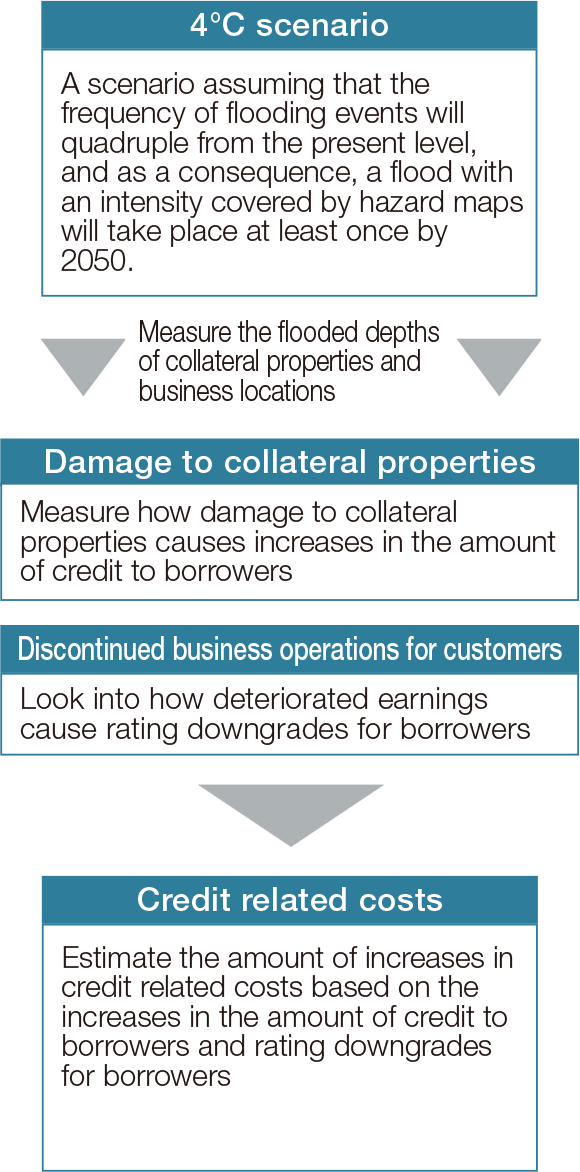
Specifically, we have analyzed how damage to collateral properties and the deteriorated earnings due to the discontinued business operations by customers will affect the Group’s credit related costs over time. We made the analysis based on materials published by the Ministry of Land, Infrastructure, Transport and Tourism and other information, assuming the 4°C scenario in which the level of flood falling under the natural disasters on hazard maps takes place.
【Procedures for analysis】

【Overview of analysis】
| Risk events | Damage to collateral properties caused by flooding, and subsequent discontinuation of business and deterioration of financial conditions for customers |
|---|---|
| Scenarios | RCP8.5 scenario※(4℃scenario) |
| Subject of the analysis | Customers with their business locations in Japan |
| Period of analysis | Until 2050 |
| Risk metrics | Credit related costs (credit costs) that will likely increase |
| Risk amount | Increase in credit related costs: Up to ¥14.6 bn |
※A scenario developed by Intergovernmental Panel on Climate Change (the “IPCC”)
Transition risks
Ⅰ Selection of sectors subject to the analysis
In view of transition risks (Policy and Legal, Industry and Market, Technology, and Reputation), we picked out four sectors of Electricity, Petrochemical, Automobile, and Metals and Mining, which is the added sector from the previous fiscal year, from our investments and loans portfolio as the sectors that will be affected most by transition risks, and have analyzed the potential risks customers will face in these sectors.
※The Oil, Gas, and Coal sector, which is included in carbon-related assets, were excluded from the scope of the analysis, as the Group’s exposure to these sectors is limited (accounting for only about 0.6% of the total amount of credit as of March 31, 2022).
Ⅱ Qualitative analysis
| Sectors subject to the analysis | Major evaluation items | Major risks | |
|---|---|---|---|
| Electricity | Policy and Legal | Carbon tax/price, reinforcement of greenhouse gas (GHG) emissions control |
|
| Industry and Market | Energy mix, etc. |
|
|
| Technology | Diffusion of low-carbon technologies |
|
|
| Reputation | Changing customer behavior |
|
|
| Petrochemical | Policy and Legal | Carbon tax/price and response to regulations on plastics |
|
| Industry and Market | Raw materials prices |
|
|
| Technology | Diffusion of renewable energy |
|
|
| Reputation | Changing customer behavior |
|
|
| Automobile | Policy and Legal | Carbon tax/price |
|
| Industry and Market | Evolution of electric vehicles (EV) |
|
|
| Technology | Diffusion of EV (a next-generation technology) |
|
|
| Reputation | Changing customer behavior |
|
|
| Metals and Mining | Policy and Legal | Carbon tax/price |
|
| Industry and Market | Evolution of multi-materials |
|
|
| Technology | Transition to low-carbon steels |
|
|
| Reputation | Changing customer behavior |
|
|
Ⅲ Quantitative analysis
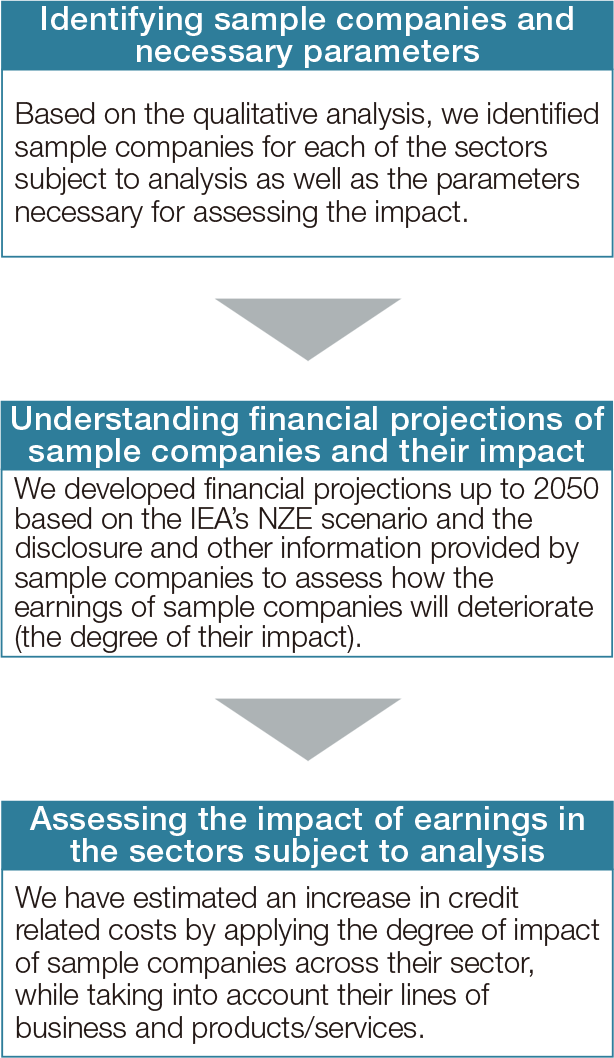
We have conducted quantitative analyses on the impacts of the Introduction of Carbon Tax, Customers’ Initiatives, Changes in the Markets, and others, which are all aimed at the transition to a decarbonized society. Specifically, we have analyzed how the deteriorated earnings of customers, as a consequence of the transition to a decarbonized society, will affect the Group’s credit related costs over time based on the projections under the IEA’s Net Zero by 2050 (NZE) scenario and the disclosure and other information provided by sample companies.
【Procedures for analysis】

【Overview of analysis】
| Risk events | Deteriorated financial position for customers as a result of the transition to a decarbonized society |
|---|---|
| Scenarios | NZE scenario※1(1.5℃scenario)、RCP2.6scenario※2(2℃scenario) |
| Subject of the analysis | Electricity, Petrochemical, Automobile, and Metals and Mining sectors |
| Period of analysis | Until 2050 |
| Risk indicators | Credit related costs (credit costs) that will likely increase |
| Risk amount | Increase in credit related costs: Up to 18.0 billion yen |
- ※1A scenario developed by International Energy Agency (the “IEA”)
- ※2A scenario developed by Intergovernmental Panel on Climate Change (the “IPCC”)
Ⅳ Status of carbon-related assets (as of March 31, 2023)
The amount of credit, which accounts for the total amount of credit※1, and the percentage of loans in each of carbon-related sectors※2 are as follows:
| Energy | Transportation | Materials and Buildings | Agriculture, Food, and Forest Products | Total | |
|---|---|---|---|---|---|
| Amount of credit | ¥177.1 billion | ¥465.1 billion | ¥2,999.9 billion | ¥271.1 billion | ¥3,913.1 billion |
| Percentage | 1.5% | 3.9% | 25.0% | 2.3% | 32.6% |
- ※1The sum of loans, acceptances and guarantees, foreign exchanges, private placement bonds, unused portions of commitment lines, etc., excluding the water supply and renewable energy power generation businesses
- ※2The sectors suggested in the TCFD recommendations are the Global Industry Classification Standard (GICS) sectors; however, the Company used the Bank of Japan’s sector classification to calculate the amounts and percentages. Therefore, there may be some differences between those calculated based on the GICS sectors and those calculated based on the BoJ’s sector classification.
(3)Results of the scenario analysis
This analysis approach found that both physical risks and transition risks have limited impacts on the Group. We will continue to increase the sophistication of our analysis. We will use the results of the analysis for our customer engagement and support our customers in making efforts to address climate change and toward decarbonization, thereby maximizing opportunities and minimizing risks for the Group and customers.
Risk Management
The Group has worked to have a more sophisticated risk management system based on the recognition that one of its most important management issues is to appropriately control risks according to the characteristics of business operations and risks in order to enhance its corporate value while ensuring its sound and safe corporate management. The Group considers climate change risks to be one type of the material risks that could have a significant impact on not only the environment but also the economy and society and to be an important issue for its business strategies. The Group has therefore stipulated in the Group Environmental Policy that the Group is committed to realizing a decarbonized society. To this end, the Group aims to have and develop proper climate change risk management.
The Group undertakes integrated risk management which quantitatively measures various types of risk including credit risk and market risk, using statistical methods, such as VaR, in order to individually manage increasingly diversified and complicated types of risk relevant to financial services, and at the same time, to comprehensively capture said risks.
Climate change risks could permeate and materially affect the Group’s business operations, strategies, and financial planning by way of credit risks, operational risks, and a broad range of complex pathways over a variety of time frames. Therefore, based on the results of the scenario analysis and qualitative analyses, we will deep-dive into how risks permeate in what time frame for each risk category, increase the sophistication of the scenario analysis, and manage risks in a comprehensive framework. We will also develop and offer optimal solutions, such as support for responses to climate change and the transition to decarbonization and support for business continuity measures, to solve the issues and needs identified through customer engagement, aiming to create business opportunities and reduce and avoid climate change risks.
Concerning investments and loans to sectors that could have a negative impact on the environment and society, we have established the Environmentally and Socially Friendly Investments and Loans Policy and sought to reduce and prevent their impact on the environment and society. Based on the policy, we have also monitored regularly if proper management is in place.
We will continue to deep-dive into how risks permeate in what time frame for each risk category and manage risks in a comprehensive framework.
1.Example of spreads of climate change risks
| Physical risks | Transition risks | |
|---|---|---|
| Credit risks | Increases in credit risk due to damage to customers’ assets, caused by the increased severity of natural disasters and the subsequent impairment of collateral values, and to the slowdown / deteriorated earnings of customers’ businesses. |
Deterioration in earnings and subsequent increases in credit risks of customers for reasons including their insufficient responses to changes associated with the transition to a decarbonized society, such as the changes in policies/regulations, markets, and technological development |
| Market risks | Increase in market risks with the declining values of securities, etc., caused by the increased severity of natural disasters |
Deterioration in earnings of investees on the back of the transition to a decarbonized society, increase in market risks coupled with a decline in the values of securities and other instruments caused by changes in investor behavior |
| Liquidity risks | Increase in liquidity risk coupled with increased outflow of funds due in part to the withdrawal of deposits by customers who were affected by the increased severity of natural disasters, and as a consequence, are cash-strapped |
Increase in liquidity risk coupled with increased funding costs on the back of a rating downgrade of the Group due in part to its insufficient response to climate change risks and the outflow of deposits |
| Operational risks | Increase in tangible asset risk, discontinued business operations, and increase in disaster prevention costs as a consequence of damage to the Group’s business locations by natural disasters |
Increase in reputational risk due to insufficient responses to the transition to a decarbonized society (e.g., insufficient disclosure, holding of carbon-related assets) |
2.Establishment and announcement of loans policy to particular sectors
Concerning investments and loans to particular sectors that could cause a negative impact on the environment and society, we have established the Environmentally and Socially Friendly Investments and Loans Policy and sought to reduce and prevent their impact on the environment and society. Since March 2021 when we established the investments and loans policy, we have not engaged in investments and loans in conflict with the policy.
| Sector | Investments and loans policy | Results of monitoring in FY2022 |
|---|---|---|
| Coal-fired power generation business | In principle, we do not engage in investments and loans for newly established coal-fired power plants. (However, exceptions may be considered after taking into account the background or characteristics of each project such as its overall power generation efficiency, its impacts on the environment and local communities, etc., based on international guidelines.※1) |
We did not engage in investments and loans for newly established coal-fired power plants in FY2022. We will reduce the existing balance※2 to zero by FY2039. |
| Deforestation business | Investment decisions for deforestation operations will be made after careful consideration of the status of their acquisition of international certifications (FSC※3 or PEFC※4), environmental considerations, and their conflicts with local communities. |
We did not engage in investments and loans for deforestation businesses. |
| Palm oil plantation development business | Investment decisions for palm oil plantation development will be made after careful consideration of the status of their acquisition of an international certification (RSPO※5), environmental considerations, and their conflicts with local communities. |
We did not engage in investments and loans for palm oil plantation development businesses. |
| Cluster munitions manufacturing business | In view of the inhumane nature of cluster munitions, we prohibit investments and loans for businesses that manufacture cluster munitions, regardless of the use of the funds. |
We did not engage in investments and loans for cluster munitions manufacturing businesses. |
| Human rights violations, forced labor, etc. | We prohibit investments and loans for businesses that violate the principles of international human rights standards※6 such as child labor and forced labor. |
We did not engage in investments and loans for businesses that violate the principles of international human rights standards such as human rights violations and forced labor. |
- ※1Including the Arrangement on Officially Supported Export Credits set forth by the Organisation for Economic Co-operation and Development (the “OECD”)
- ※2The balance of existing investments and loans include only the projects in which the business operators had adopted the best technology available for the scale of power generation of each project (BAT: Best Available Technology) when the investments were made.
- ※3Forest Stewardship Council. A non-profit organization that operates an international forest certification system based on the principle of appropriate, socially beneficial, and economically sustainable forest management from the perspective of environmental protection
- ※4Forest certification program. An international umbrella organization that promotes examination of forest certification systems that have been individually developed in each country based on the Intergovernmental Process for Sustainable Forest Management, which covers 85% of the world’s forests, and that promotes mutual recognition of these systems
- ※5Roundtable on Sustainable Palm Oil. An organization that develops globally trusted certification standards to promote sustainable palm oil production and use
- ※6Including Universal Declaration of Human Rights, and UN Guiding Principles on Business and Human Rights
Metrics and Targets
The Group has set the targets below and created a roadmap for aligning with the Paris Agreement, realizing a decarbonized society, and achieving net-zero CO2 emissions, and monitored them with various metrics.We regularly report the progress made toward the targets and the use of metrics to the Sustainability Committee and the Board of Directors, reflect them in the strategy, and receive supervision.
1.Sustainable finance
We have set targets to execute sustainable finance for a cumulative total of ¥3 trillion, of which the environment fields represent ¥2 trillion, over the period from FY2021 to FY2030.
During the period from FY2021 to FY2022, we executed ¥615.4 billion of sustainable finance, including ¥347.9 billion in environmental fields.
| Target (FY2021–FY2030) |
Results (FY2021–FY2022) |
Progress rate | |
|---|---|---|---|
| Sustainable finance | ¥3 trillion | ¥615.4 billion | 20.5% |
| Of which, the environmental related finance | ¥2 trillion | ¥347.9 billion | 17.4% |
Definition of Sustainable Finance
“Finance to support customers’ activities aiming to realize a sustainable society through solving environmental and social issues,” as referenced in related external standards (the Green Loan Principles, the Green Bond Principles, the Social Bond Principles, etc.)
| Target sectors of the sustainable finance | |
|---|---|
| Environment related fields | Projects that help adapt to/mitigate climate change, such as renewable energy projects Capital investments that contribute to renewable energy, energy saving, and carbon neutrality |
| Social fields | Projects that contribute to regional revitalization and recreation Projects that contribute to fostering start-ups and job creation |
2.CO2 emissions
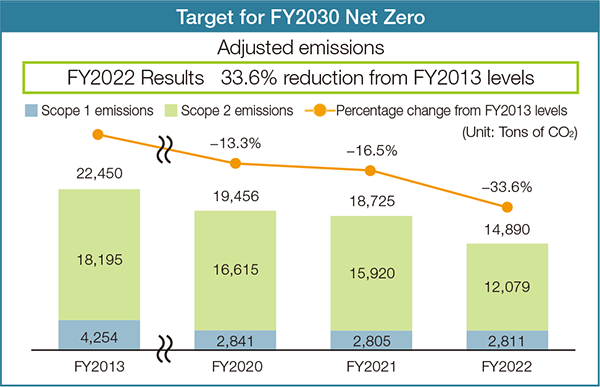
(1)CO2 emissions reduction target (Scope 1 and Scope 2)
As part of the efforts to strengthen our response to climate change, we started this fiscal year to measure CO2 emissions across the Group—all Group companies, in addition to Joyo Bank and Ashikaga Bank in the previous fiscal year. We will continue to work at achieving the target by reviewing and revising the roadmap, as needed, in light of factors such as technological trends and changes in environment.
Substantive adoption of renewable energy
| Adoption timing | Buildings that adopted renewable energy | Estimated reduction effect | |
|---|---|---|---|
| Joyo Bank | Ashikaga Bank | ||
| July 2022 |
|
|
4,293 tons of CO2 per year※1 |
| April 2023 |
|
1,710 tons of CO2 per year※2 | |
| Total | 4 buildings | 3 buildings | 6,003 tons of CO2 per year※3 |
- ※1Calculated based on the adjusted emission factors for FY2020 by TEPCO Energy Partner, Incorporated
- ※2Calculated based on the adjusted emission factors for FY2021 by TEPCO Energy Partner, Incorporated
- ※3Equivalent to approx. 32% of CO2 emissions (adjusted emissions) at the Group in FY2021
(2)CO2 emissions (Scope 3)
The sum of Scope 3 emissions of Joyo Bank and Ashikaga Bank is as follows: We started to measure Scope 3 emissions for categories 1 through 5 and 15 from this fiscal year.
| Category | Emissions (Tons of CO2) | |
|---|---|---|
| Category 1 | Products and services purchased | 6,267 |
| Category 2 | Capital goods | 8,146 |
| Category 3 | Fuels and energy activities not included in Scope 1 and Scope 2 | 2,237 |
| Category 4 | Transportation and delivery (upstream) | 534 |
| Category 5 | Waste generated through business | 29 |
| Category 6 | Business trip | 1,128 |
| Category 7 | Commuting of employees | 3,398 |
| Category 15 | Investments and loans | 20,498,197 |
| Total | 20,519,939 | |
※No emissions were measured for categories 8 through 14.
【Category 15 (investments and loans)】
- We measured Scope 3 emissions of all the businesses to which Joyo Bank and Ashikaga Bank provided loans, with reference to PCAF※1 standard measurement methods.
- There are mainly two measurement processes. The bottom-up approach measures Scope 3 emissions from actual CO2 emissions sourced from disclosed data and other information. The top-down approach estimates carbon emissions using sector-specific carbon intensity. We used the bottom-up approach for businesses whose disclosures were available to us and the top-down approach for the rest.
- We will use the measurement results for our customer engagement to contribute to realizing a decarbonized society.
- We will make our measurements more accurate and expand the scope of measurement.
【Emissions by sector (14 carbon-related sectors of TCFD)】
| Sector | Carbon intensity※2 (tons of CO2 / Million yen) |
Emissions※3 (tons of CO2) |
|---|---|---|
| Agriculture | 5.89 | 1,458,252 |
| Paper manufacturing and Forestry | 8.70 | 695,192 |
| Beverages and Foods | 2.75 | 17,463 |
| Metals and Mining | 9.96 | 1,743,079 |
| Chemicals | 9.19 | 1,046,476 |
| Oil and Gas | 12.89 | 813,025 |
| Construction materials and Capital goods | 3.50 | 5,047,827 |
| Automobile | 4.64 | 596,757 |
| Electricity | 34.15 | 991,046 |
| Real estate management and development | 0.71 | 284,740 |
| Land transportation | 3.80 | 930,120 |
| Maritime transportation | 20.03 | 130,289 |
| Air transportation | 9.73 | 12,430 |
| Others | 2.72 | 6,731,495 |
| Total | ― | 20,498,197 |
- ※1Partnership for Carbon Accounting Financials, an international initiative to develop methods for measuring and disclosing GHG emissions through financial institutions’ investment and loan portfolios
- ※2Formula for calculating sector-specific carbon intensity:
Carbon intensity = ∑ (CO2 emissions from businesses to which the banks provided loans / Sales of the businesses) / Number of the businesses - ※3Formula for calculating emissions (top-down approach):
Emissions = ∑ (Carbon intensity of each of the businesses to which the banks provided loans x Sales of the business) / Degree of contribution of loans provided by Joyo Bank and Ashikaga Bank
Note: The above calculations used the outstanding balance of loans provided to customers as of March 31, 2023 and their latest financial results that Joyo Bank and Ashikaga Bank had as of March 31, 2022.
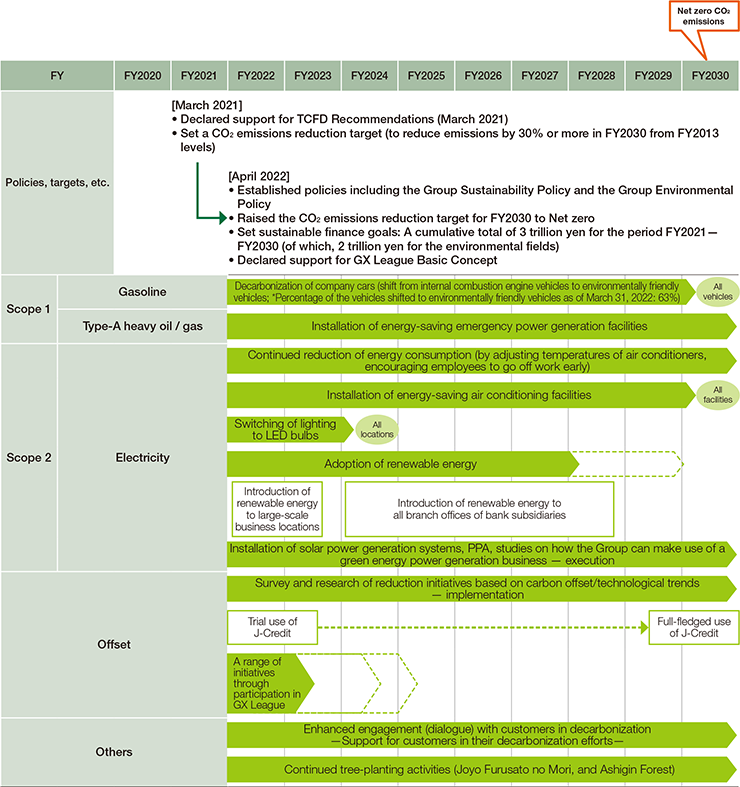
(3)Roadmap to Net zero CO2 emissions
Roadmap to achieving the “CO2 emission reduction target of Net zero in FY2030” is as shown below.
We will review and revise the roadmap, as needed, taking into factors such as technological trends and changes in environment.
Environment-friendly Business Activities
Environment Data on Energy Consumption (Joyo Bank + Ashikaga Bank)
| Items (unit) | FY2020 | FY2021 | FY2022 | |||||||
|---|---|---|---|---|---|---|---|---|---|---|
| Total of two banking subsidiaries |
The Joyo Bank, Ltd. | The Ashikaga Bank, Ltd. | Total of two banking subsidiaries |
The Joyo Bank, Ltd. | The Ashikaga Bank, Ltd. | Total of two banking subsidiaries |
The Joyo Bank, Ltd. | The Ashikaga Bank, Ltd. | ||
| Target: Energy consumption per 1 square meter Total energy consumption (KL)/Area(square meter) |
0.0264 | 0.0257 | 0.0272 | 0.0266 | 0.0258 | 0.0277 | 0.0264 | 0.0263 | 0.0265 | |
| Energy consumption per 1 square meter: Total energy consumption (KL)/Area (square meter) |
0.0269 | 0.0261 | 0.0280 | 0.0267 | 0.0266 | 0.0267 | 0.0250 | 0.0251 | 0.0249 | |
| Direct Energy Consumption | Kerosene (KL) | 2 | 2 | 0 | 0 | 0 | 0 | 0 | 0 | 0 |
| Light Oil (KL) | 0 | 0 | 0 | 0 | 0 | 0 | 0 | 0 | 0 | |
| Heavy Oil (KL) | 142 | 5 | 137 | 140 | 10 | 130 | 116 | 4 | 112 | |
| LPG (t) | 43 | 38 | 5 | 27 | 23 | 4 | 35 | 31 | 4 | |
| City Gas (thousand cubic meter) | 104 | 71 | 33 | 107 | 74 | 33 | 120 | 89 | 31 | |
| Indirect Energy Consumption | Electric Power (MWh) | 36,478 | 20,793 | 15,685 | 34,733 | 19,979 | 14,754 | 32,005 | 18,446 | 13,559 |
| Steam (Gj) | 1,921 | 1,921 | 0 | 2,050 | 2,050 | 0 | 2,074 | 2,074 | 0 | |
| Hot Water (Gj) | 0 | 0 | 0 | 0 | 0 | 0 | 0 | 0 | 0 | |
| Cold Water (Gj) | 0 | 0 | 0 | 0 | 0 | 0 | 0 | 0 | 0 | |
| Area (square meter: ㎡) | 358,170 | 209,700 | 148,470 | 343,826 | 197,700 | 146,126 | 338,909 | 195,012 | 143,897 | |
| Total energy consumption (KL) | 9,629 | 5,475 | 4,154 | 9,168 | 5,260 | 3,908 | 8,477 | 4,893 | 3,584 | |
Greenhouse Gas (GHG) Emission (from the entire Group, but for Scope 3, total of two banking subsidiaries)
| Items | Unit | FY2020 | FY2021 | FY2022 |
|---|---|---|---|---|
| GHG emission Scope 1 (Direct emission) |
t-CO2 | 2,841 | 2,805 | 2,811 |
| GHG emission Scope 2 (Indirect emission) |
t-CO2 | 16,615 | 15,920 | 12,079 |
| GHG emission Scope 3 (Category 1 - 15) |
t-CO2 | Not measured | 3,441 | 20,519,939 |
| o/w Category 1 (products/services purchased) |
t-CO2 | Not measured | Not measured | 6,267 |
| o/w Category 2 (capital goods) |
t-CO2 | Not measured | Not measured | 8,146 |
| o/w Category 3 (fuels and energy-related activities not included in Scope 1 and 2) |
t-CO2 | Not measured | Not measured | 2,237 |
| o/w Category 4 (transportation, delivery/upstream) |
t-CO2 | Not measured | Not measured | 534 |
| o/w Category 5 (wastes generated through business) |
t-CO2 | Not measured | Not measured | 29 |
| o/w Category 6 (business trip) |
t-CO2 | Not measured | 776 | 1,128 |
| o/w Category 7 (commuting) |
t-CO2 | Not measured | 2,665 | 3,398 |
| o/w Category 8 (lease assets/upstream) |
t-CO2 | Not measured | Not measured | 0 |
| o/w Category 9 (transportation, delivery/downstream) |
t-CO2 | Not measured | Not measured | 0 |
| o/w Category 10 (processing of products sold) |
t-CO2 | Not measured | Not measured | 0 |
| o/w Category 11 (use of products sold) |
t-CO2 | Not measured | Not measured | 0 |
| o/w Category 12 (disposal of products sold) |
t-CO2 | Not measured | Not measured | 0 |
| o/w Category 13 (lease assets/downstream) |
t-CO2 | Not measured | Not measured | 0 |
| o/w Category 14 (franchise) |
t-CO2 | Not measured | Not measured | 0 |
| o/w Category 15 (investment and loan) |
t-CO2 | Not measured | Not measured | 20,498,197 |
| Total GHG emission (Scope 1 and 2) |
t-CO2 | 19,456 | 18,725 | 14,890 |
| Total GHG emission (Scope 1, 2, and 3) |
t-CO2 | Not measured | 22,166※ | 20,534,830 |
※For Scope 3, only Category 6 and 7
Initiatives for conservation and restoration of natural capital and biodiversity
Participation in the Taskforce on Nature-related Financial Disclosures (TNFD) Forum
In addition to responses to climate change, the conservation of natural capital, including biodiversity, is growing in importance for the realization of a sustainable society.
In January 2024, Mebuki Financial Group declared its support for the initiatives of the Taskforce on Nature-related Financial Disclosures (TNFD) and participated in the TNFD Forum. Through our participation in the Forum, in addition to analysis and deliberations in line with the TNFD’s disclosure framework, we will contribute to building a framework for the disclosure of nature-related financial information.
Climate Change and Environmental Conservation Activities
Forest Development Activities
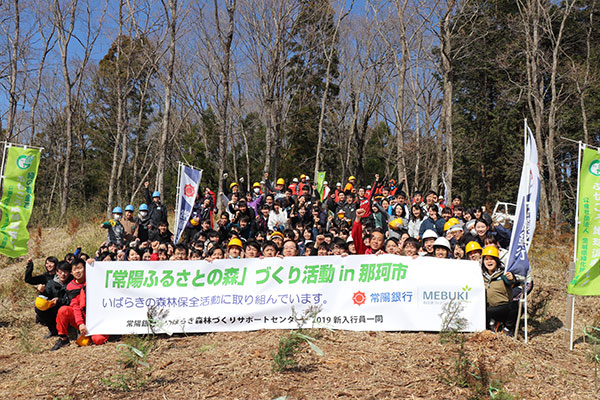
Developing “Joyo Furusato no Mori”
In order to preserve the beauty and health of local woodlands for future generations, Joyo Bank created woodlands called “Joyo Furusato no Mori” in Naka City and at Mt. Tsukuba in 2009, protecting and nurturing the greenery in its home prefecture through forest thinning and tree planting activities. In recognition of 10 years of environmental protection activities, Joyo Bank received the “2019 Earth friendly Company Award Eco-friendly Partnership Category” from Ibaraki Prefecture in December 2019. (Joyo Bank)
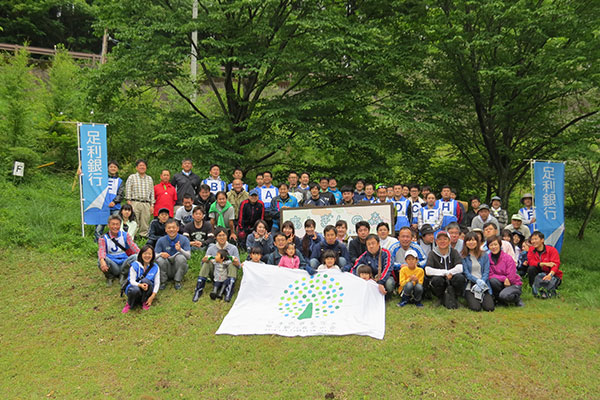
Developing “Ashigin Forest”
Since 2012, Ashikaga Bank has developed “Ashigin Forest” as tree planting activities by employees and their families. And they continuously develop walkways and remove the underbrush for that obstructs growth, to have local residents enjoy seasonal scenery. (Ashikaga Bank)
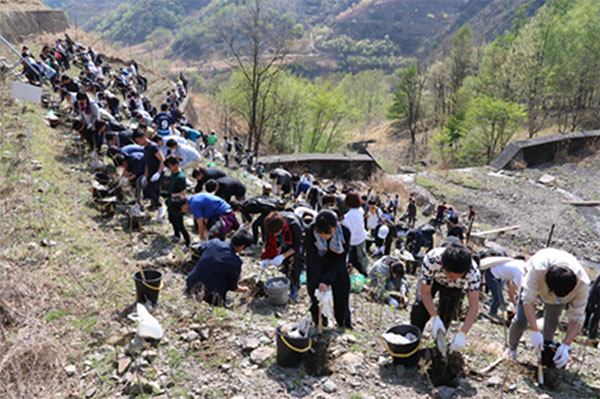
Tree Planting at the Ashio Mountain
Ashikaga Bank supports the activities of “NPO Grow Green in Ashio”, which works to reforest Ashio Mountain which had been devastated by smoke pollution, and considers the problems in the headwaters area of the Watarasegawa River in order to create a healthy natural environment. The Bank engages in tree-planting activities there every year with new employees and member companies of the Tochigi Prefecture Industrial Cooperation Council. (Ashikaga Bank)
Other activities
Protection of Nikko Cedar Avenue
Ashikaga Bank supports the Nikko Cedar Avenue Ownership System operated by Tochigi Prefecture to protect this world-famous arboreal asset at the Nikko cluster of temples and halls. Since then we have continuously stepped up purchases, and now own 80 cedar trees (as of March 31, 2021), the most cedar trees owned by one group, at a cost of ¥10 million per tree. In addition, the Bank is working on beautification activities, including participation in the cleanup at the Avenue. (Ashikaga Bank)
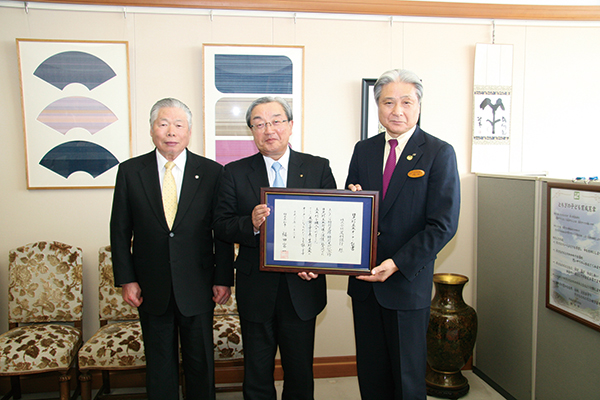

“Eco-Ibaraki” Environmental Conservation Trust
The Group provides grants to organizations engaged in environmental conservation activities in Ibaraki Prefecture.
Eco-Ibaraki is a charitable trust established jointly by the Joyo Bank and Sompo Japan Insurance Inc. in 1992. Each year since its establishment, the trust has been awarding grants to applicants selected through a screening process conducted by the trust’s management committee. (Joyo Bank)
Subsidies provided through charitable trusts, etc. (cumulative total)
| Number of subsidies made | Subsidy amount |
|---|---|
| 1,669 | ¥179.44 million |
- Corporate Information
- IR & SR
- ESG
- Financial Statements & Integrated Report / Financial Data(Annual Report)


